Figure 5

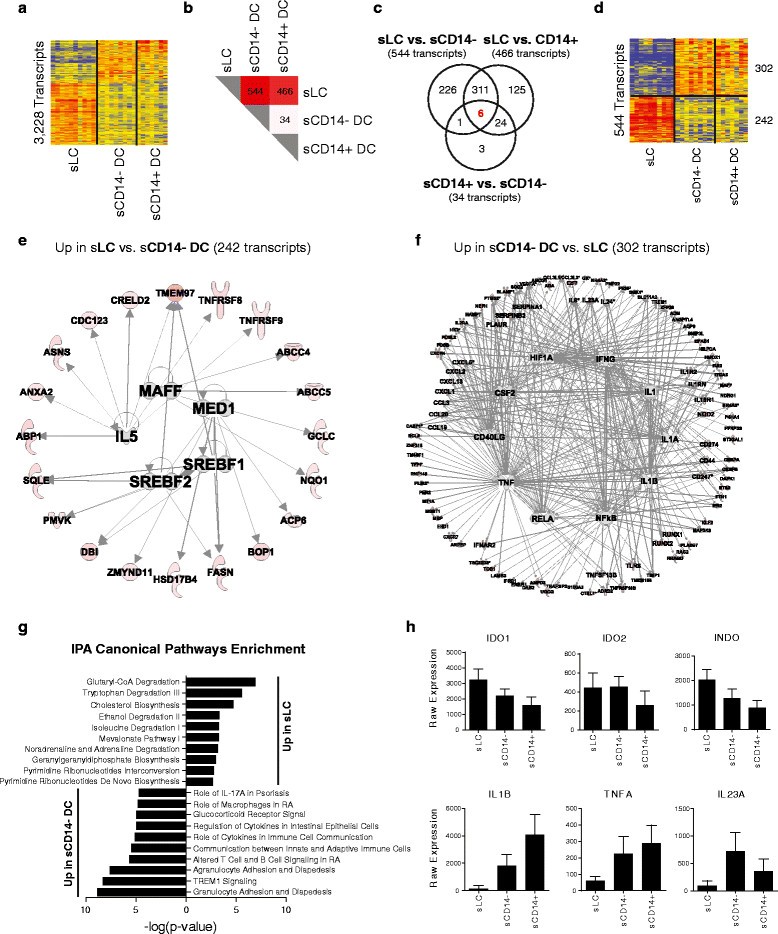
Transcriptional analysis of skin dendritic cell subsets. (a) Hierarchical clustering (Pearson correlation) of the 3,228 transcripts differentially expressed (one-way ANOVA, P < 0.05, Benjamini-Hochberg correction) between the three skin DC populations. (b) Heatmap representing the results of Tukey’s test conducted after ANOVA. (c) Venn diagram of the three comparisons conducted during the post hoc test. (d) Hierarchical clustering (Pearson correlation) of the 544 transcripts differentially expressed between sLCs and sCD14- DCs. (e) IPA network analysis for the 242 transcripts over-expressed in sLCs compared with sCD14- DCs. Molecules are colored according to their fold change in the condition represented compared with the median. (f) IPA network analysis for the 302 transcripts over-expressed in sCD14- DCs compared with sLCs. (g) Bar chart representing the IPA canonical pathway enrichment in sLCs and sCD14- DCs. (h) Bar charts representing the batch-corrected expression values for selected transcripts over-expressed in sLCs (top row) or sCD14- DCs (bottom row).
