Fig. 4
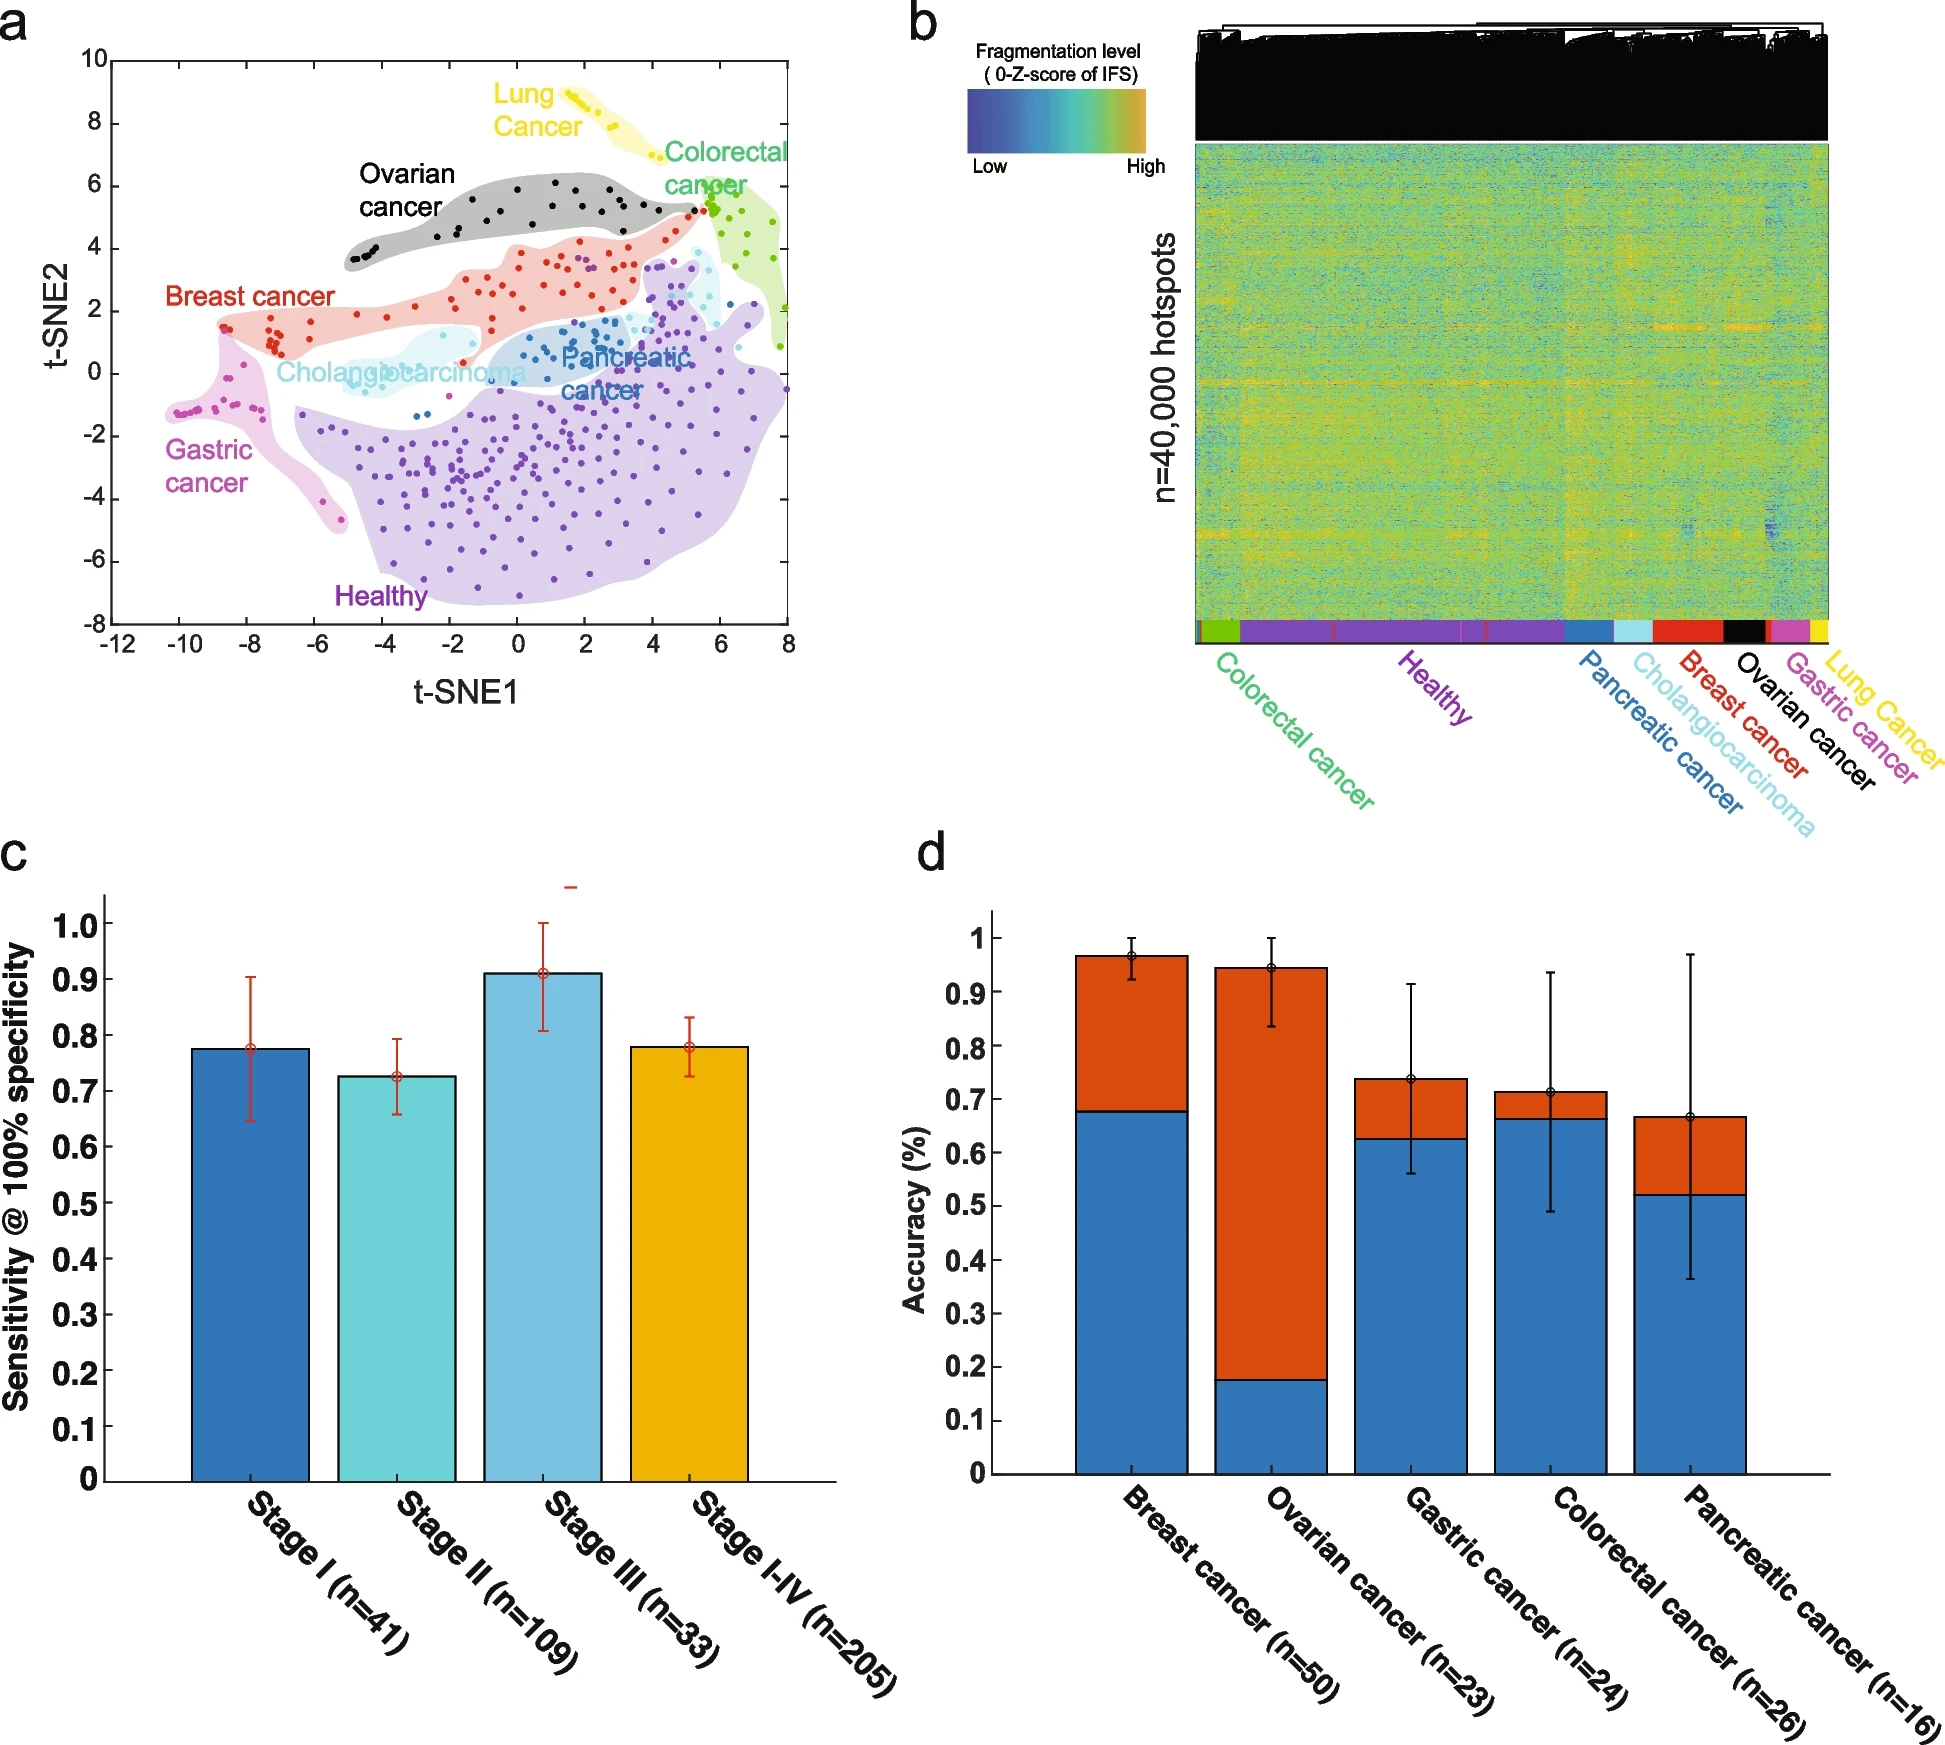
The detection and localization of multiple early-stage cancers. a t-SNE visualization on the z-score of IFS (after GC bias correction) at the most variable cfDNA fragmentation hotspots (one-way ANOVA test with p-value < 0.01) across multiple different early-stage cancer types and healthy conditions. b Unsupervised clustering on z-score of IFS (after GC bias correction) at the top 40,000 most variable cfDNA fragmentation hotspots across multiple different early-stage cancer types and healthy conditions. c The sensitivity across different cancer stages at 100% specificity to distinguish cancer and healthy condition by using IFS (after GC bias correction) at cfDNA fragmentation hotspots. Error bars represent 95% confidence intervals. d Percentages of patients that were correctly classified by one of the two most likely types (sum of orange and blue bars) or the most likely type (blue bar). Error bars represent 95% confidence intervals